What If You Invested $10,000 in the Nasdaq 100 in 2000?
By Amiel Riss · Published 20 April 2026 · Updated 9 September 2026
Nasdaq 100 in 2000: The Biggest Bubble
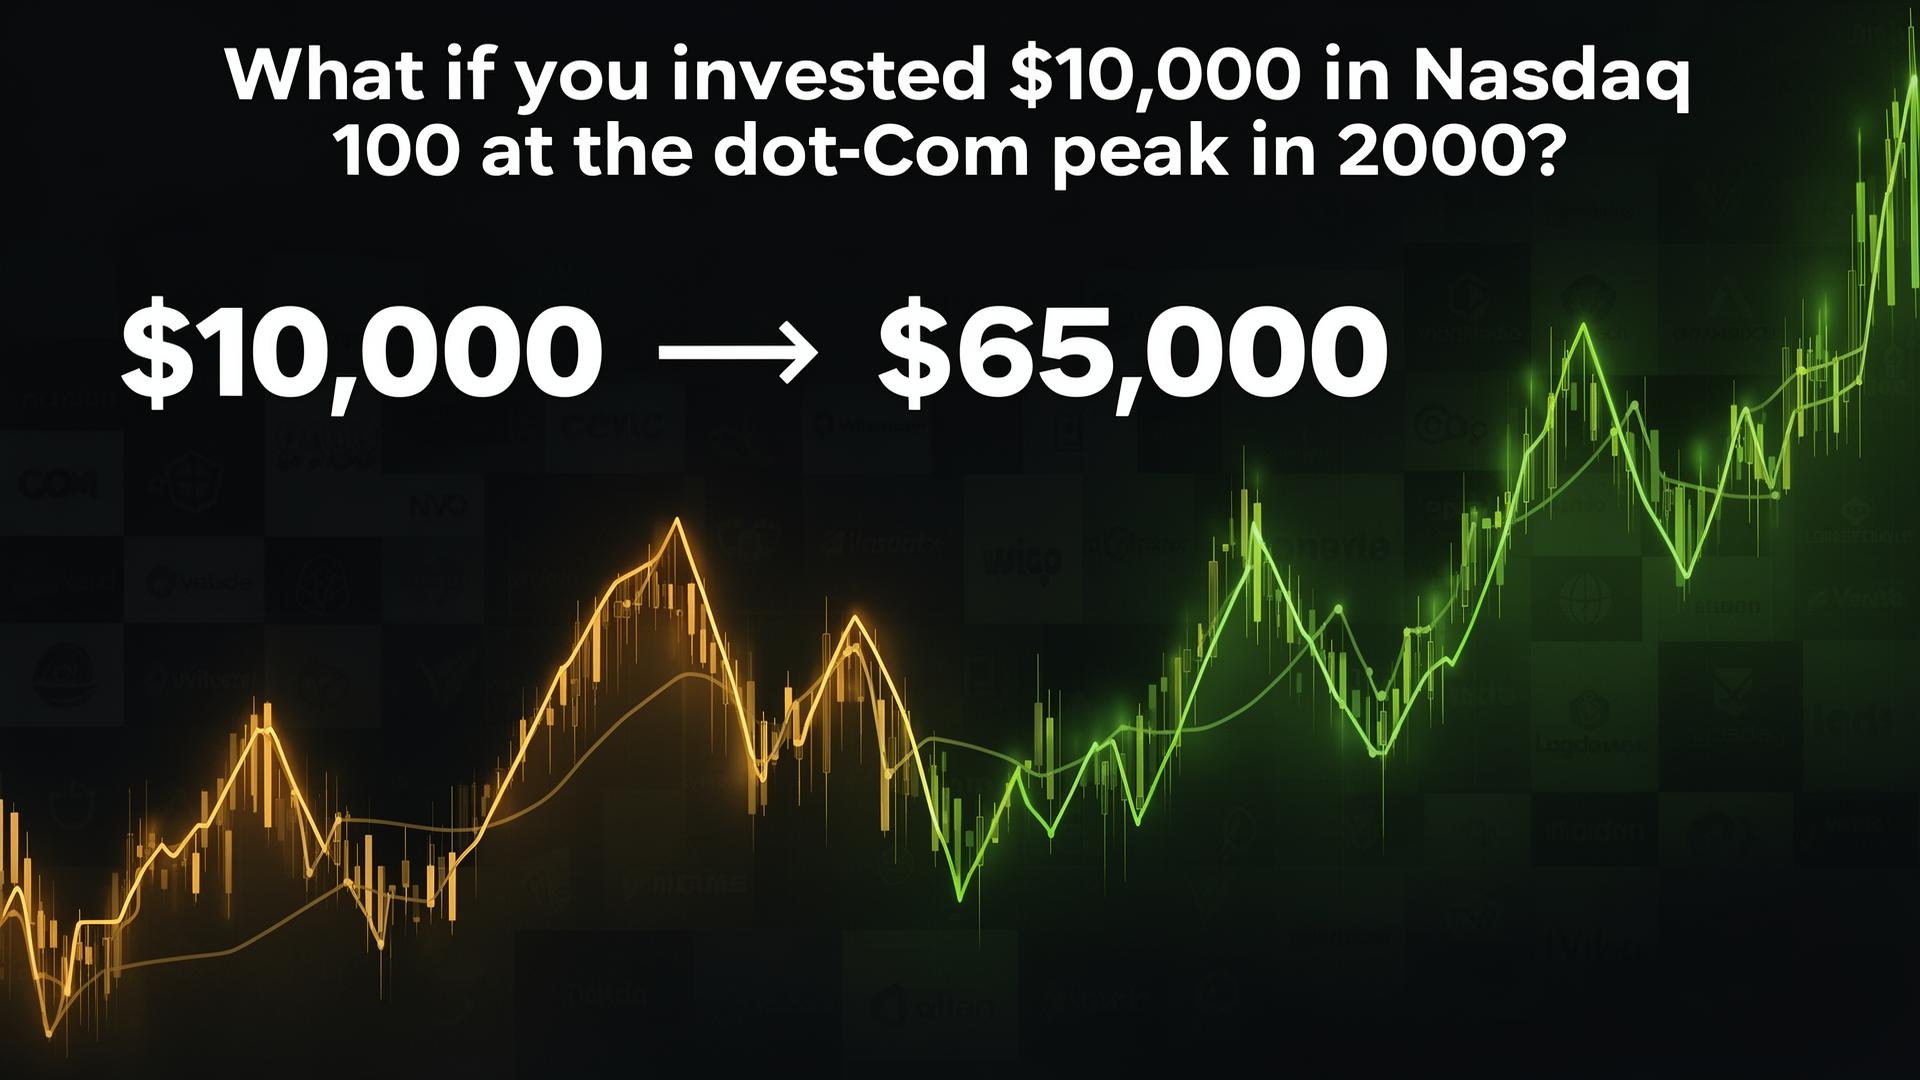
In March 2000, the Nasdaq 100 peaked at 4,816. Dot-com companies with no revenue were valued in billions. Across all of 2000 the index actually ranged from $2,288 to $4,816, averaging $3,552 — that's the entry price behind the numbers below for $10,000 invested in QQQ. Use the calculator to convert to today's rupees.
Then it all collapsed.
| Year | Portfolio Value |
|---|---|
| 2000 | $10K |
| 2003 | $3K |
| 2006 | $5K |
| 2009 | $4K |
| 2012 | $7K |
| 2015 | $12K |
| 2018 | $19K |
| 2021 | $41K |
| 2024 | $54K |
| 2026 | $75K |
The Timeline: 82% Crash, 15 Years to Recover, Then AI
- 2000-2002: Dot-com bust. From its 2000 high to its 2002 low, the index fell -83.5%.
- 2003-2007: Slow recovery. Google, Amazon emerge. Index: $1,983.
- 2008: Global financial crisis. Index: $1,552.
- 2009-2015: iPhone era begins. Index: $4,305.5. 15 years to break even.
- 2016-2020: FAANG dominates. Index: $9,830.
- 2021-2022: Peak and correction. Index: $14,591 → $13,326.
- 2023-2026: AI boom. "Magnificent 7." Index: $26,800.
The Lesson: Indices Survive When Companies Don't
$10,000 invested in 2000 is worth about $75,450 today — anywhere from $55,648 to $1,17,133 depending on where in that volatile year you bought, a total return of +654.5% — but only after 15 years of patience. Convert to rupees with the calculator's live exchange rate. Indian investors can access Nasdaq 100 via Motilal Oswal Nasdaq 100 ETF or fund-of-funds. Buying at the 2000 high meant that $10,000 was worth $13,559 the moment it was bought and fell to $2,238 by the 2002 low — a drop of -83.5% before the long road back to even began.
- Index investing works: Pets.com died, but the Nasdaq 100 thrived.
- Access from India: Motilal Oswal, ICICI Pru, and Kotak offer Nasdaq 100 fund-of-funds.
- Try the calculator: Nasdaq 100 History Calculator.
📊 Methodology Note
Calculations use with dividends reinvested (Total Return) Nasdaq 100 (NDX) prices from Yahoo Finance (^NDXTR, total return). The engine holds one low and one high for each year: the entry price is the midpoint of the entry year's range, and today's price is the midpoint of the 2026 range. Coverage starts in 1985. Data verified: August 2026. Past performance does not guarantee future results.
Common Mistakes When Investing in NASDAQ 100
- Panic-selling during crashes: Investors who sold in March 2020 or 2008 missed the rapid recovery. NIFTY and global indices have always recovered long-term.
- Timing a lump-sum entry: "Waiting for the bottom" rarely works. A monthly SIP removes the timing problem altogether.
- Picking high-fee funds: A passive index fund/ETF costs 0.05%-0.5% per year. An actively managed mutual fund costs 1.5%-2.25% — that's lakhs of rupees difference over decades.
- Skipping rebalancing: Without periodic rebalancing, equity allocation drifts higher as markets rally, and your portfolio risk grows silently.
Frequently Asked Questions
How much would $10,000 in Nasdaq 100 from 2000 be worth today?
$10,000 invested in the Nasdaq 100 in March 2000 would be worth around $75,450 today — $55,648 to $1,17,133 depending on when in that volatile year you bought. Use the calculator to see the rupee value at today's live exchange rate. But it took 15 years to break even.
How much did the Nasdaq 100 crash in 2000?
The Nasdaq 100 fell -83.5% from its March 2000 high to its 2002 low. It didn't recover to its 2000 level until around 2015 — 15 years later.
How can Indians invest in the Nasdaq 100?
Indian investors can access Nasdaq 100 via Motilal Oswal Nasdaq 100 ETF (on NSE), ICICI Pru Nasdaq 100 FoF, or directly through international brokers under LRS.
Nasdaq 100 vs Nifty 50 — which is better?
Nasdaq 100 is tech-heavy and more volatile. Nifty 50 is diversified across Indian sectors. Ideally, invest in both for geographic diversification.
Is NASDAQ 100 still a good investment today?
Broad index investing remains one of the most effective long-term wealth-building strategies in India too. The key is consistent SIPs over 10+ years rather than timing the market. Past performance is not a guarantee of future results.
📊 Data source: Yahoo Finance. Prices and data in this article are reviewed and updated semi-annually. Last update: September 2026.
Try Our Calculator
$10,000 in the Nasdaq 100 at the dot-com peak. 15 lost years, then AI and FAANG drove it to $75,450+ today.
📈 Nasdaq 100 CalculatorTags: #Nasdaq #Nasdaq 100 #Index Fund #Stock Market #What If?
Share this article
Related Calculator
- 📈 Nasdaq 100 Calculator — How much would you have made investing in the Nasdaq 100?
- ☕ Latte Factor Calculator — How much is your daily chai worth at retirement?
- 🔥 FIRE Number Calculator — What's your number for financial freedom?
You might also enjoy
- ☕ Is Your Daily Chai and Samosa Stealing Your Future Wealth?
That daily break for Chai and snacks costs around ₹150. It seems tiny, but in the world of financial freedom, this habit is a "silent thief"...
- 🔥 Early Retirement in India: Calculating Your FIRE Goal
Retiring by 40 or 45 is no longer a luxury for the few in India; it is a calculated goal for many young professionals...