What If You Invested $10,000 in the Nasdaq 100 at the Dot-Com Peak?
By Amiel Riss · Published April 20, 2026 · Updated September 9, 2026
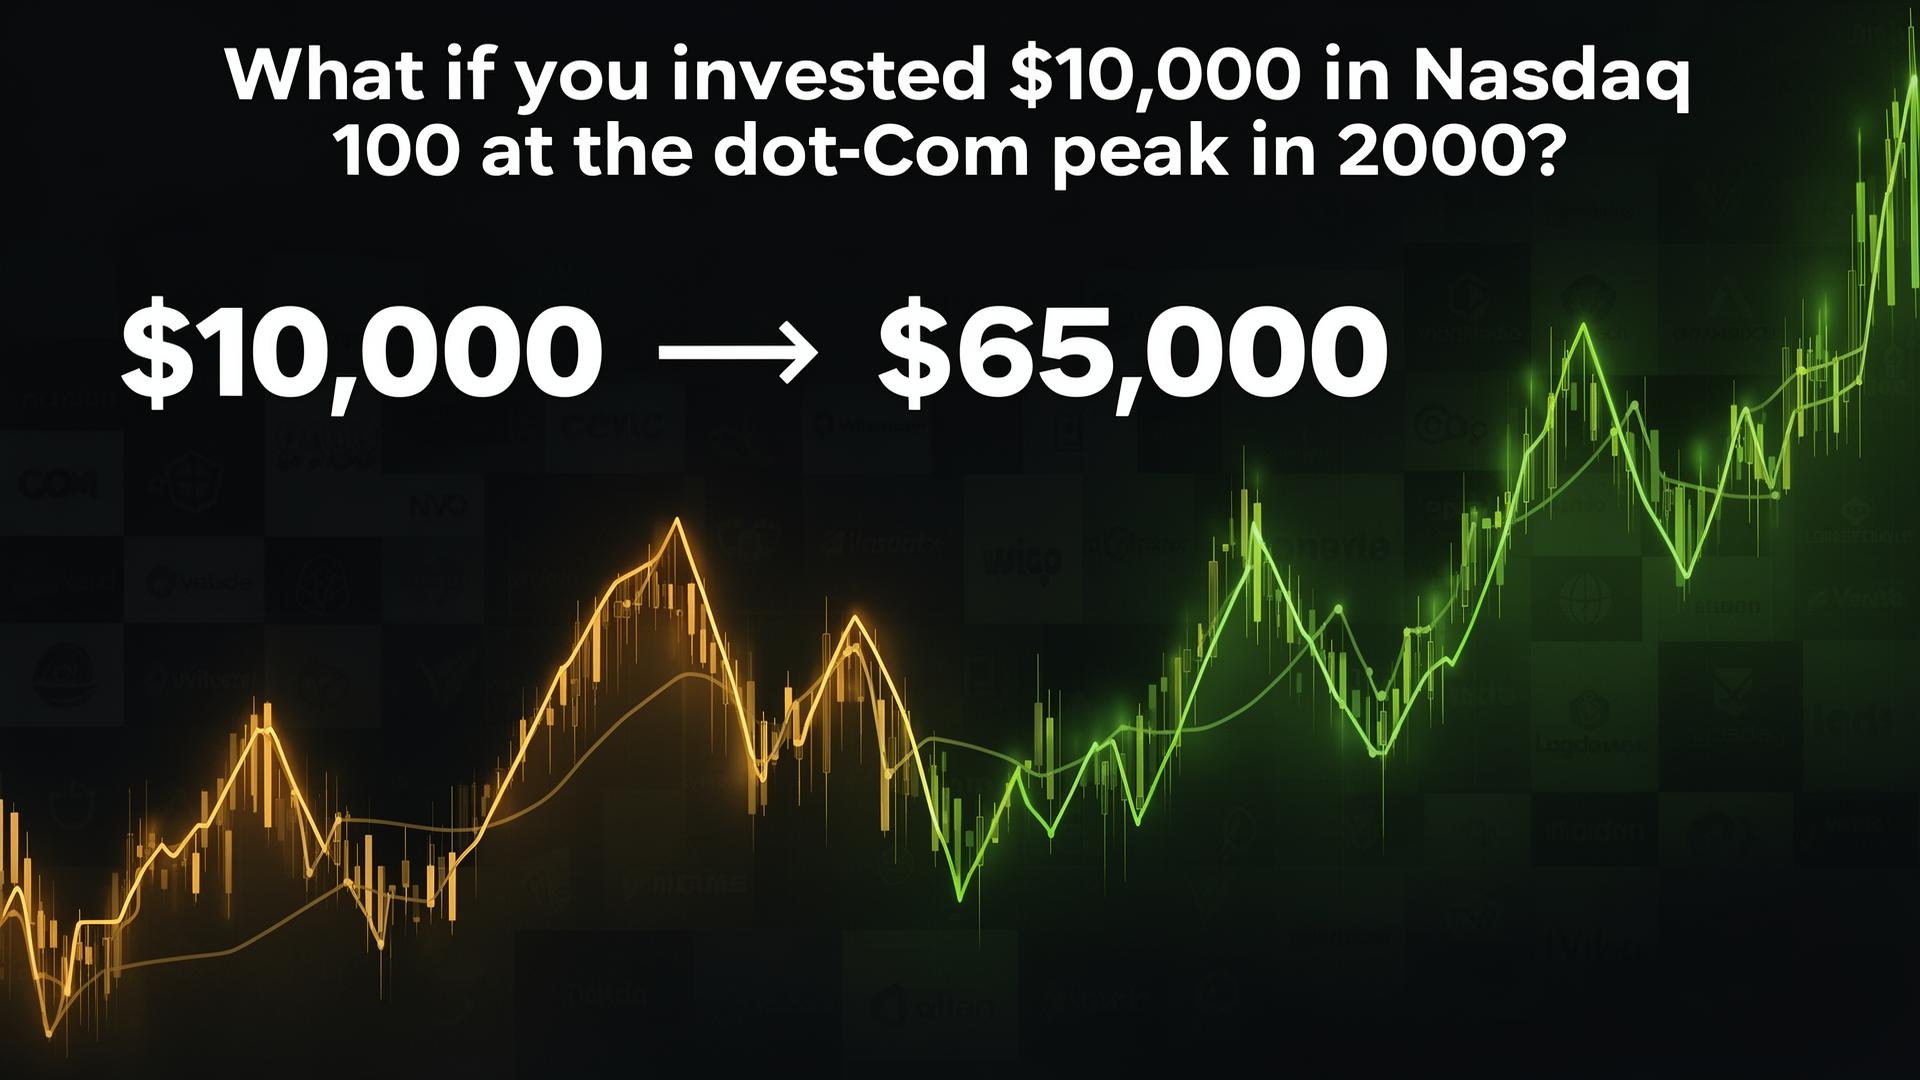
Nasdaq 100 in March 2000: Peak Bubble
In March 2000, the Nasdaq 100 hit an all-time high of 4,816 points. Dot-com companies with no revenue traded at insane multiples. Pets.com, Webvan, eToys — they were all "the future."
Across all of 2000 the index actually ranged from $2,288 to $4,816, averaging $3,552 — that's the entry price behind the numbers below for $10,000 invested in QQQ (the Nasdaq 100 ETF) that year.
| Year | Portfolio Value |
|---|---|
| 2000 | $10K |
| 2003 | $3K |
| 2006 | $5K |
| 2009 | $4K |
| 2012 | $7K |
| 2015 | $12K |
| 2018 | $19K |
| 2021 | $41K |
| 2024 | $54K |
| 2026 | $75K |
The Timeline: From 4,816 to 800 — and Back to 22,000
- 2000-2002: Dot-com bubble bursts. From its 2000 high to its 2002 low, the index fell -83.5%. Most dot-coms vanish.
- 2003-2007: Slow recovery. Google, Amazon, Apple start growing. Index: $1,983.
- 2008: Financial crisis. Index: $1,552.
- 2009-2015: "The tech decade" begins. iPhone, cloud, smartphones. Index: $4,305.5. 15 years to break even.
- 2016-2020: FAANG drives everything. Index: $9,830.
- 2021: New all-time high. Index: $14,591.
- 2022: Rates rise. From its 2021 high to its 2022 low, the index fell -37.0%.
- 2023-2026: AI boom. "Magnificent 7." Index: $26,800.
The Lesson: Even After an 82% Drop, Patience Paid Off
$10,000 invested in 2000 is worth about $75,450 today — anywhere from $55,648 to $117,133 depending on where in that volatile year you bought, a total return of +654.5% (+8.1% a year). But it took 15 years just to break even. Then the real gains began. Buying at the 2000 high meant that $10,000 was worth $13,559 the moment it was bought and fell to $2,238 by the 2002 low — a drop of -83.5% before any of the eventual gain arrived.
- Indices survive — individual companies don't always: Pets.com vanished, but the index recovered.
- Diversification works: Nasdaq 100 = the 100 largest tech companies. Less risk than a single stock.
- Try the calculator: Nasdaq 100 History Calculator.
📊 Methodology Note
Calculations use with dividends reinvested (Total Return) Nasdaq 100 (NDX) prices from Yahoo Finance (^NDXTR, total return). The engine holds one low and one high for each year: the entry price is the midpoint of the entry year's range, and today's price is the midpoint of the 2026 range. Coverage starts in 1985. Data verified: August 2026. Past performance does not guarantee future results.
Common Mistakes When Investing in NASDAQ 100
- Panic-selling during crashes: Investors who sold in 2008 or March 2020 missed the rapid recovery. The market has always recovered in the long run.
- Timing a lump-sum entry: "Waiting for the bottom" usually fails. Monthly DCA removes the timing problem altogether.
- Picking high-fee funds: A passive index ETF costs 0.03%-0.2% per year. An actively-managed mutual fund costs 1.5%-2% — the difference is hundreds of thousands over decades.
- Skipping rebalancing: Without periodic rebalancing, your portfolio drifts toward equities as they rally, increasing risk silently.
Frequently Asked Questions
How much would $10,000 in Nasdaq 100 from 2000 be worth today?
$10,000 invested in the Nasdaq 100 in March 2000 would be worth around $75,450 today — $55,648 to $117,133 depending on when in that volatile year you bought. But it took about 15 years just to break even.
How much did the Nasdaq 100 drop in the dot-com crash?
The Nasdaq 100 fell -83.5% from its 2000 high to its 2002 low. Most dot-com companies vanished entirely.
What's the difference between Nasdaq 100 and S&P 500?
Nasdaq 100 contains the 100 largest non-financial companies listed on Nasdaq. S&P 500 contains 500 companies across all sectors. Nasdaq is more concentrated and volatile.
How can I invest in the Nasdaq 100?
Buy QQQ (the most popular Nasdaq 100 ETF) through any brokerage. Many international brokers and robo-advisors also offer access.
Is NASDAQ 100 still a good investment today?
Broad index investing remains one of the most effective long-term wealth-building strategies. The key is to invest consistently and hold for 10+ years rather than trying to time entries. Past performance is not a guarantee of future results.
📊 Data source: Yahoo Finance. Prices and data in this article are reviewed and updated semi-annually. Last update: September 2026.
Try Our Calculator
$10,000 invested in the Nasdaq 100 at the bubble peak. The crash, 15 lost years, then the greatest tech revolution ever.
📈 Nasdaq 100 CalculatorTags: #Nasdaq #Nasdaq 100 #Index Fund #Stock Market #What If?
Share this article
Related Calculator
- 📈 Nasdaq 100 Calculator — How much would you have made investing in the Nasdaq 100?
- ☕ Latte Factor Calculator — How much is your daily coffee worth at retirement?
- 🔥 FIRE Number Calculator — What's your number for financial freedom?
You might also enjoy
- ☕ Is Your Daily Latte Costing You $411,409?
We all know the morning routine: standing in line, and it's "only" $6. But this coffee has a hidden price tag far higher than what's on the menu...
- 🔥 When Can You Quit? Discover Your FIRE Number
The FIRE movement has ignited a global shift in how we view work and life. Find out how much you need to never work again...